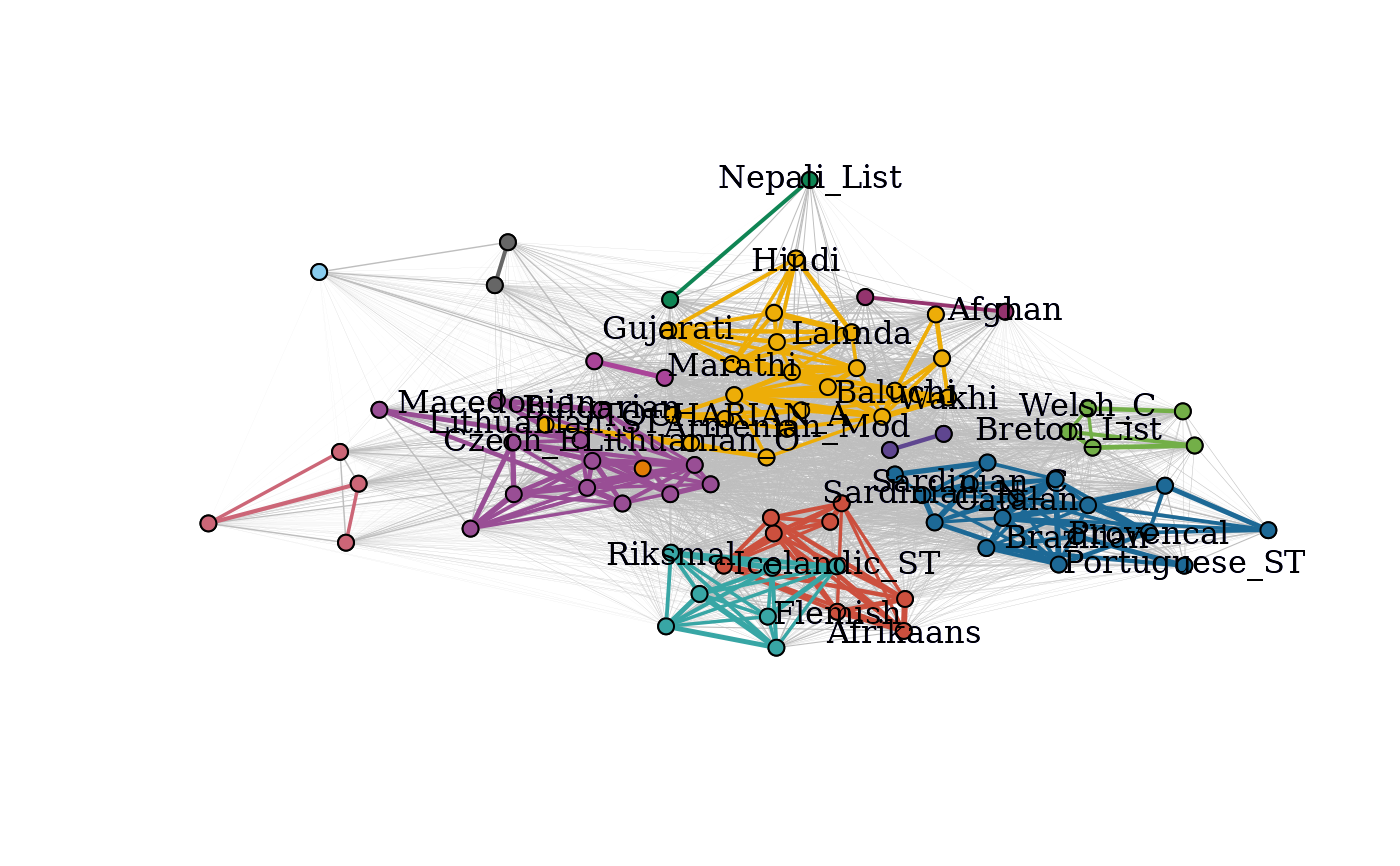
Provides a plot of the community graphs, with connected components of the graph of strong ties colored by connected component.
Usage
plot_community_graphs(
  c,
  show_labels = TRUE,
  only_strong = FALSE,
  emph_strong = 2,
  edge_width_factor = 50,
  colors = NULL,
  ...
)
Arguments
- c
A
cohesion_matrixobject, a matrix of cohesion values (seecohesion_matrix).- show_labels
Set to
FALSEto omit vertex labels (to display a subset of labels, use optional parametervertex.labelto modify the label list). Default:TRUE.- only_strong
Set to
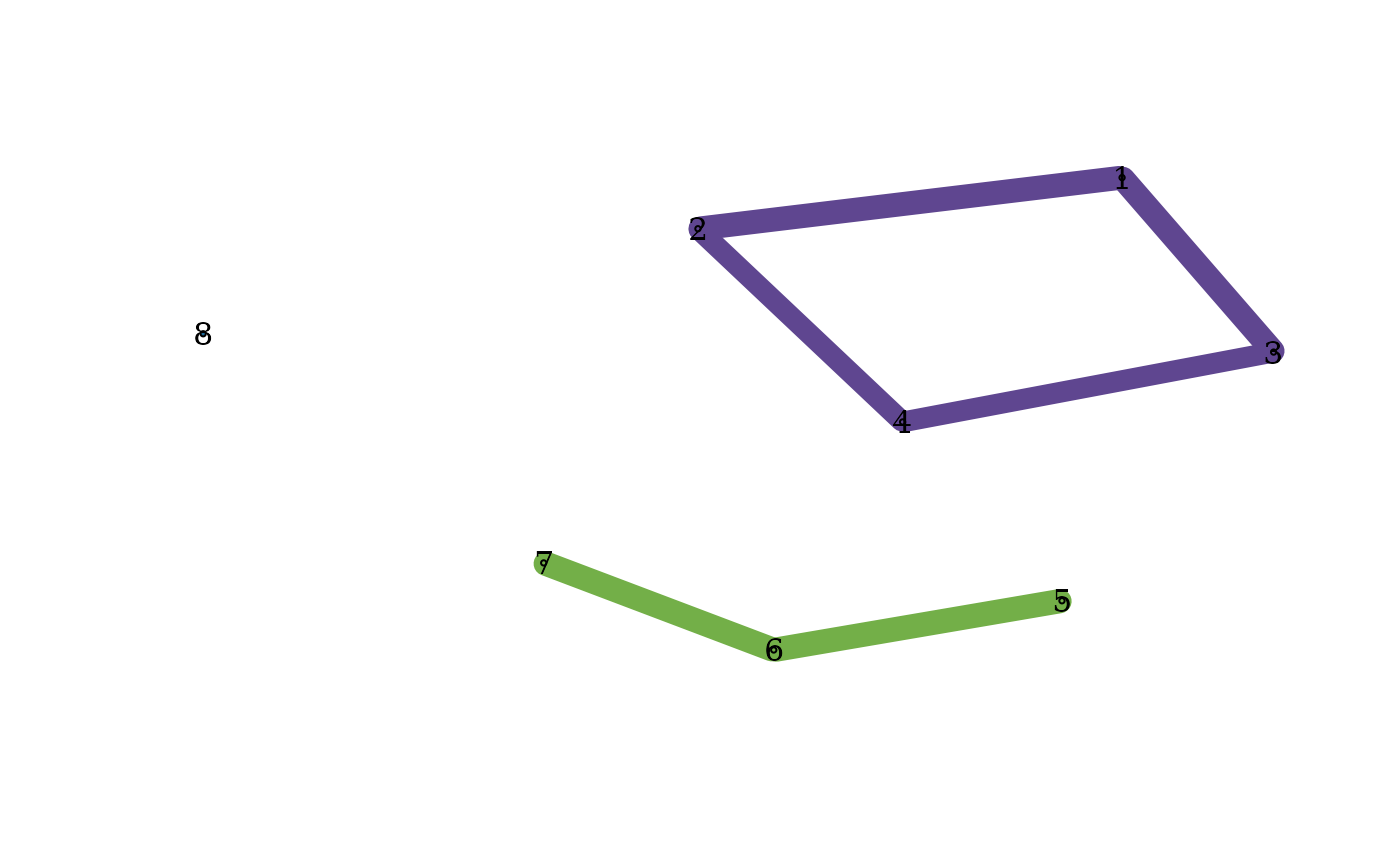
TRUEif only strong ties, G_strong, should be displayed; the defaultFALSEwill show both strong (colored by connected component) and weak ties (in gray).- emph_strong
Numeric. The numeric factor by which the edge widths of strong ties are emphasized in the display; the default is
2.- edge_width_factor
Numeric. Modify to change displayed edge widths. Default:
50.- colors
A vector of display colors, if none is given a default list (of length 24) is provided.
- ...
Optional parameters to pass to the
igraph::plot.igraph. function. Some commonly passed arguments include:layoutA layout for the graph. If none is specified, FR-graph drawing algorithm is used.vertex.labelA vector containing label names. If none is given, the rownames ofcare usedvertex.sizeA numeric value for vertex size (default =1)vertex.color.vecA vector of color names for coloring the verticesvertex.label.cexA numeric value for modifying the vertex label size. (default =1)
Details
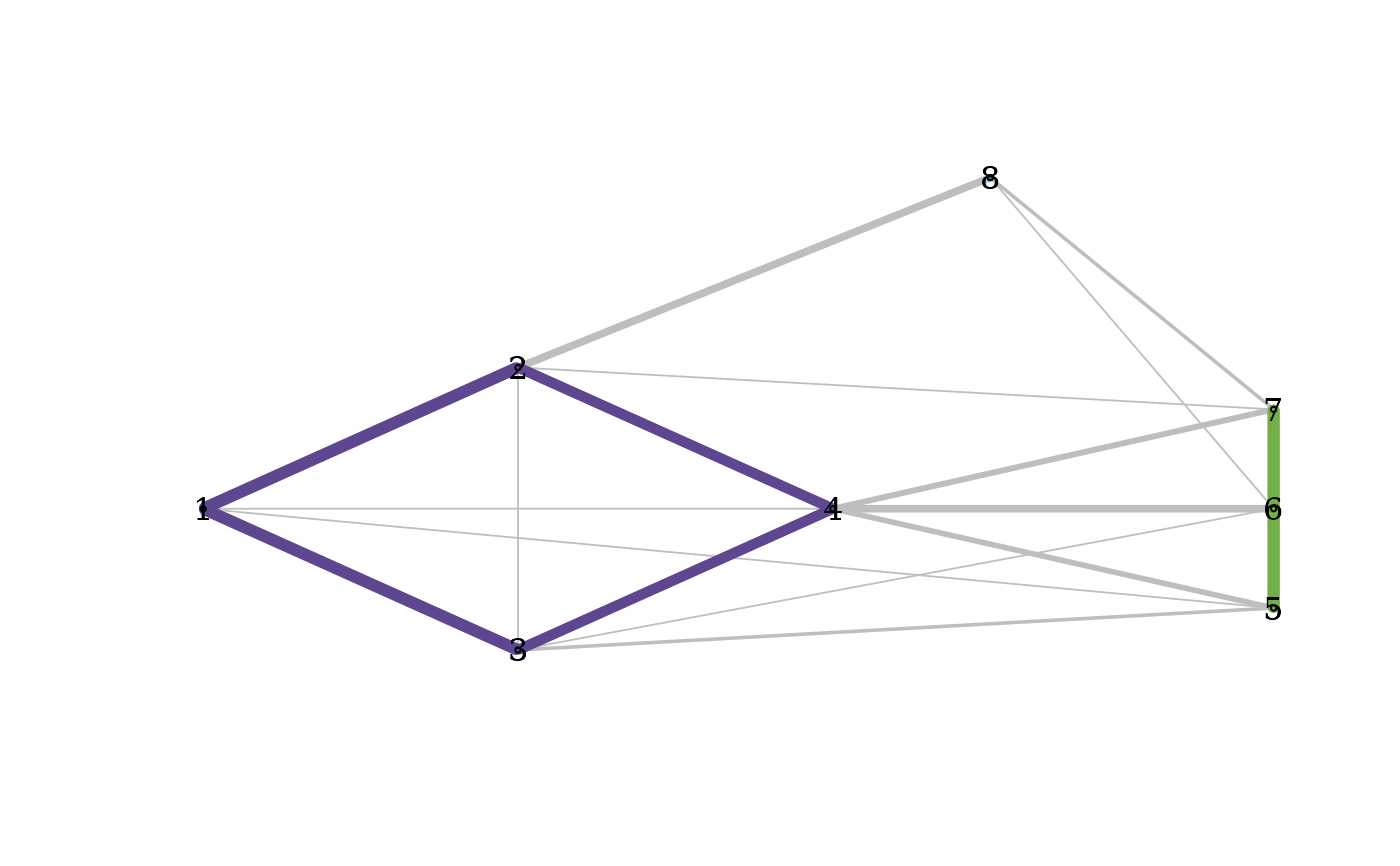
Plots the community graph, G, with the sub-graph of strong ties emphasized
and colored by connected component. If no layout is provided, the
Fruchterman-Reingold (FR) graph drawing algorithm is used.
Note that the FR graph drawing algorithm may provide a somewhat different
layout each time it is run. You can also access and save a given graph
layout using community_graphs(C)$layout.
The example below shows how to display only a subset of vertex labels.
Note that the parameter emph_strong is for visualization purposes
only and does not influence the network layout.
Examples
C <- cohesion_matrix(dist(exdata1))
plot_community_graphs(C, emph_strong = 1, layout = as.matrix(exdata1))

plot_community_graphs(C, only_strong = TRUE)


C2 <- cohesion_matrix(cognate_dist)
subset_lang_names <- rownames(C2)
subset_lang_names[sample(1:87, 60)] <- ""
plot_community_graphs(C2, vertex.label = subset_lang_names, vertex.size = 3)
C2 <- cohesion_matrix(cognate_dist)
subset_lang_names <- rownames(C2)
subset_lang_names[sample(1:87, 60)] <- ""
plot_community_graphs(C2, vertex.label = subset_lang_names, vertex.size = 3)