Assessing the Association Between Accident Injuries and NCAP Car Safety Ratings
Lucy D’Agostino McGowan & Ryan Jarrett
Not So Standard Deviations is currently my writing muse (see my inspiration from their 28th Episode). This week, Roger Peng was discussing traffic data (listen here), inspiring me to solicit some input on a weird result my colleague Ryan and I found this summer.
Summary
This past August we won the Government Statistics Section JSM Data Challenge. We found that in mid-sized cars, vehicles that were in accidents with lower star ratings were more likely to have injured passengers (Figures 2 and 4). We delve into this further with an interactive scatterplot (Figure 5), allowing the user to examine the specific make and star rating of each car, along with the % of accidents with at least one injured passenger. You will notice there is certainly a sparsity of data in these lower-stare regions, in terms of types of vehicles, however they do represent a decent proportion of the weighted sample (201,239.8 (8.1%)).
Figure 2: Maximum Injury by Saftey Rating (Weight 3000-3499lb)
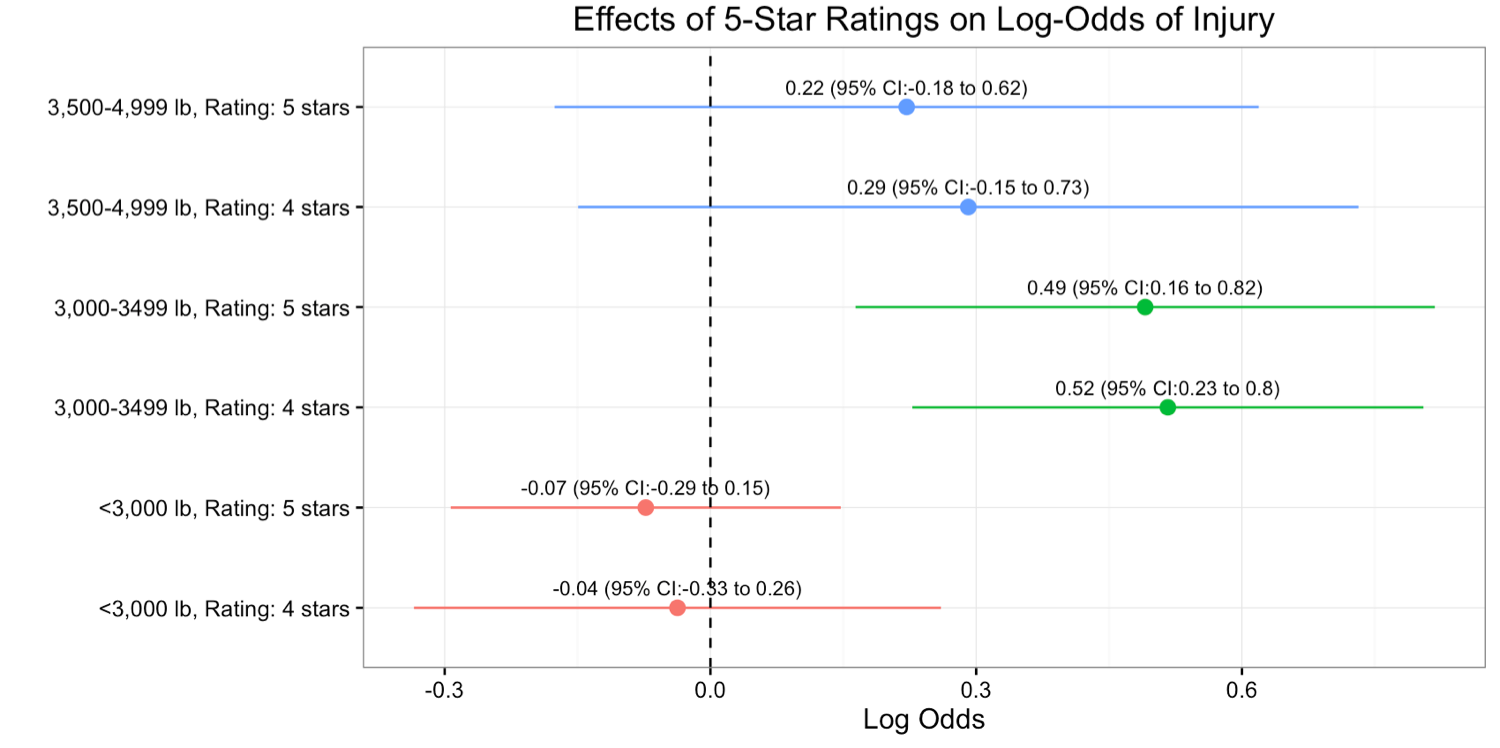
Figure 4: Effect of 5-star ratings on log odds of injury, stratified by weight class, adjusting for accident condition variables (weather, point of impact, type of accident etc.) and passenger-level variables (age, sex, alcohol, seat-belt use, etc.), with 2-3 star rated vehicles as the reference.
Figure 5: Percent injured by rating & vehicle make and model.
We are hoping this will pique your interest. Perhaps we missed an important confounder, or maybe our data was too sparce to be conclusive, or maybe you think this whole thing is silly, and we definitely shouldn’t have won…either way we’d like your input! All of the data can be found here along with our raw analysis files. I would love to collaborate on this. Continue reading for more detailed information about our analysis.
Background
- Each year millions of new cars are sold in the US.
- 65% of new car consumers report that safety was their primary concern (Consumer National Reports Research Center, 2012)
Saftey Ratings
- Safety tests are conducted by the NHTSA on a subset of cars each year
- Tests are conducted under highly controlled circumstances with test dummies in the driver and front passenger seats
- frontal collision at 35 mph
- side collision at 38.5 mph
- Each car model tested subsequently receives (among others) an overall rating out of 5 stars.
- Safety ratings are only comparable within weight class
Methods
Data Sources
- National Automotive Sampling System (NASS) General Estimates System (GES) for the years 2011-2014
- Maximum injury severity
- Accident condition variables (weather, point of impact, type of accident etc.)
- Passenger-level variables (age, sex, alcohol, seat-belt use, etc.)
- NHTSA safety ratings (obtained from www.safercar.gov)
- Overall safety rating
- Weight of the vehicle
- Note: we obtained this data by scraping from the website; we attempted to contact NHTSA for a comprehensive list of ratings that was potentially more reliable than this method, but were not able to obtain one. Please let us know if you have access to this dataset!
Weighting Scheme
- Nationally representative probability sample selected from all police-reported crashes.
- Eligibility:
- A Police Accident Report must be completed for the crash
- Crash must involve at least one motor vehicle traveling on a trafficway
- Crash must result in property damage, injury, or death
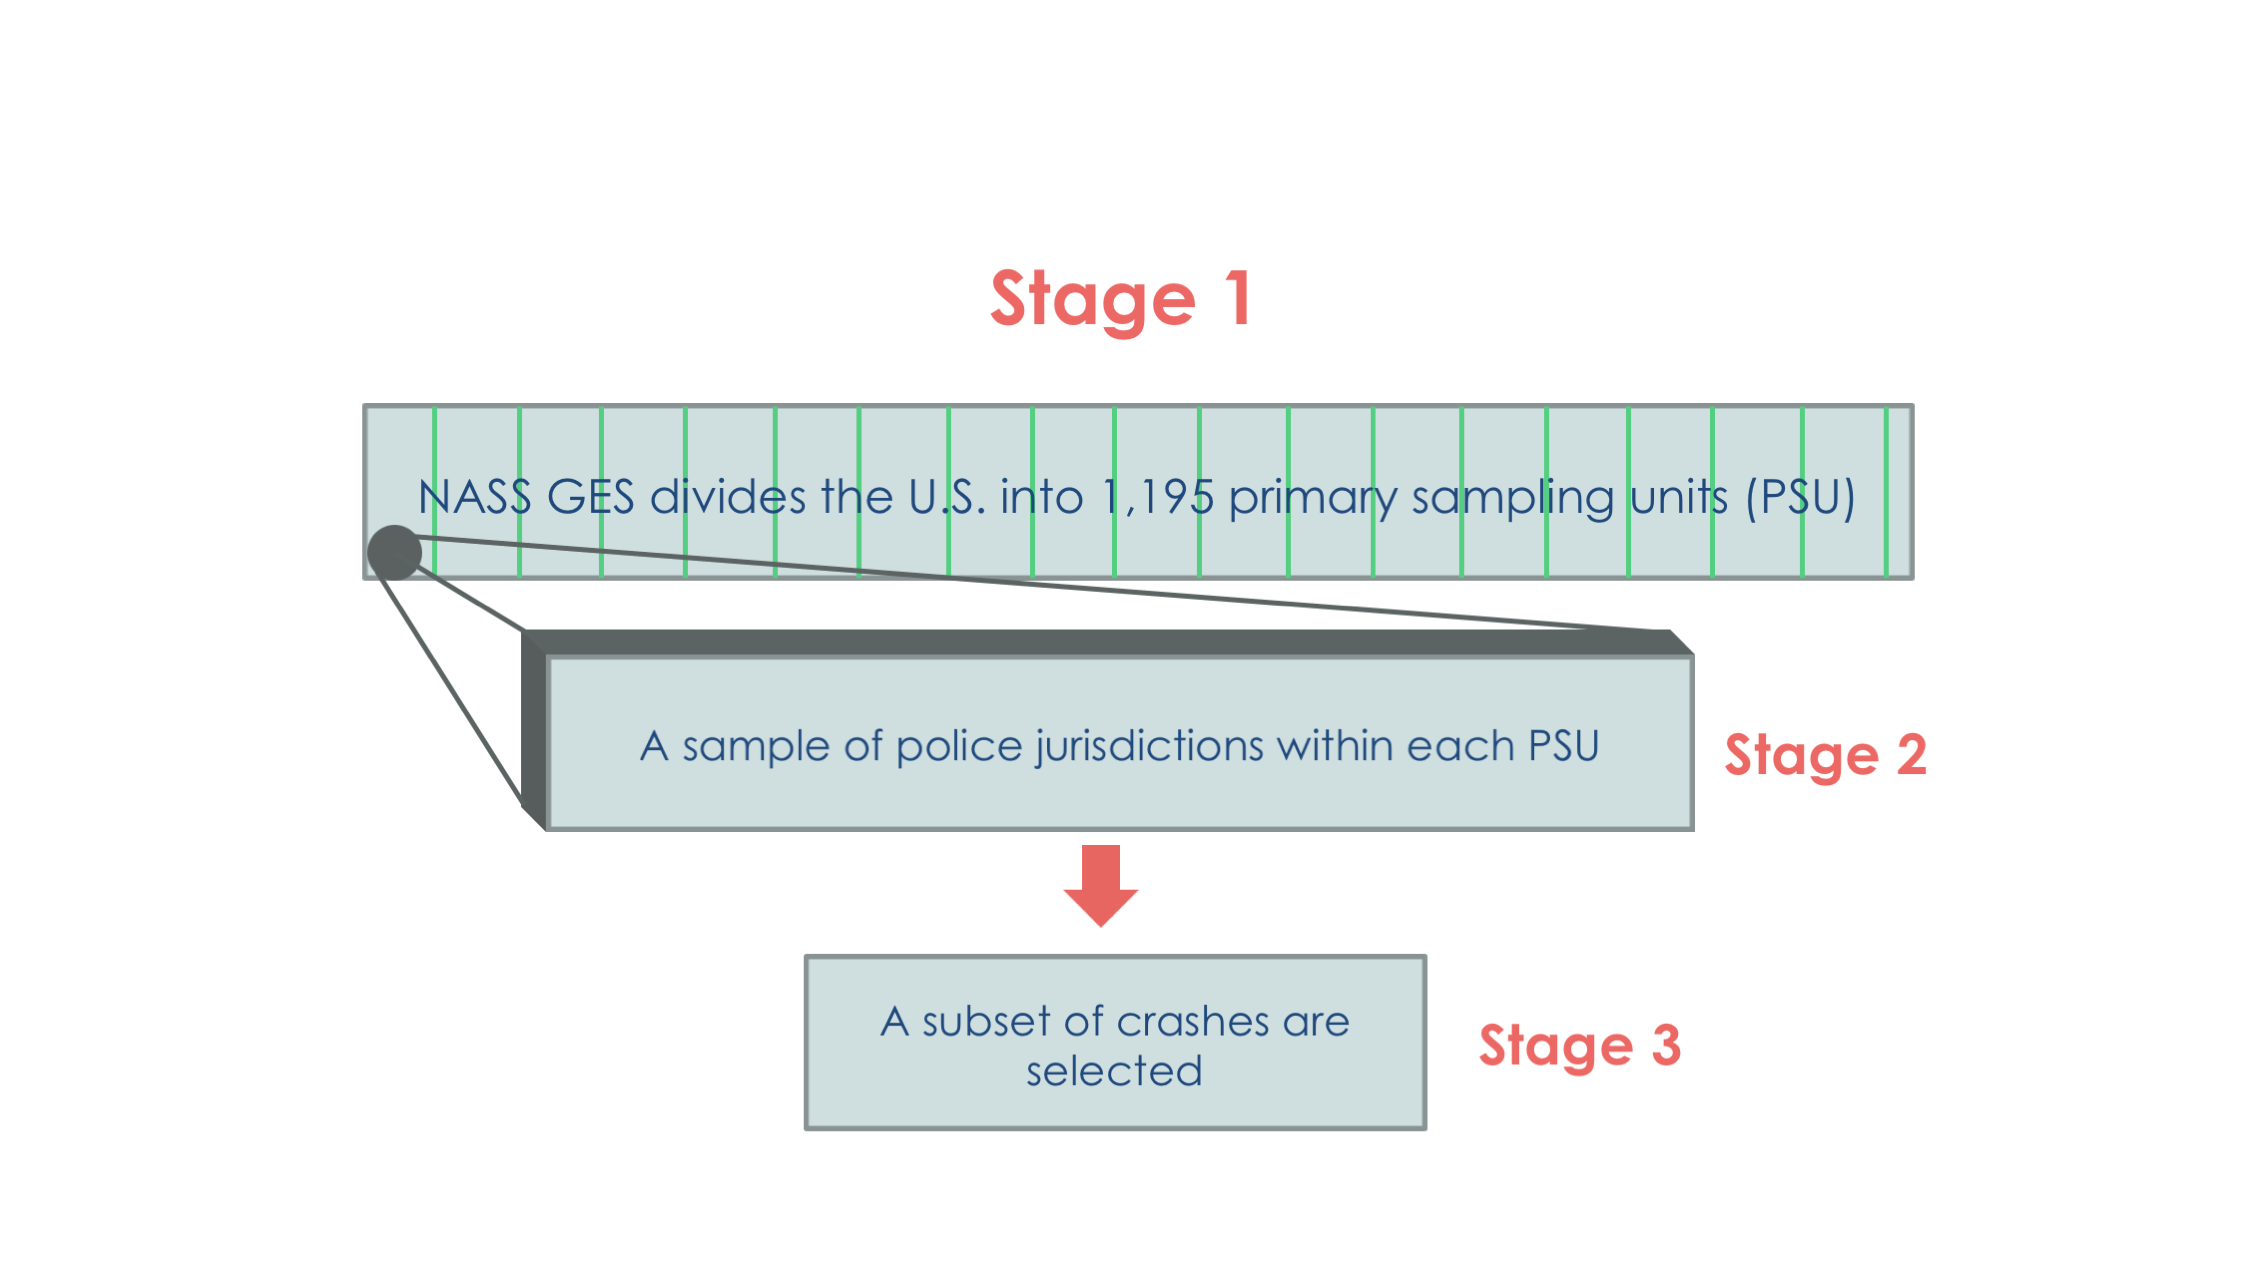
- Stage 1 is a sample of geographic areas, called Primary Sampling Units (PSUs), from across the United States. The NASS GES divides the United States into 1,195 PSUs.
- Stage 2 is a sampling of police jurisdictions within each PSU based upon probability proportional to the number of crashes investigated in a given jurisdiction. An average of seven police jurisdictions have been selected within each PSU.
- Stage 3 is the selection of crashes within the sampled police jurisdictions.
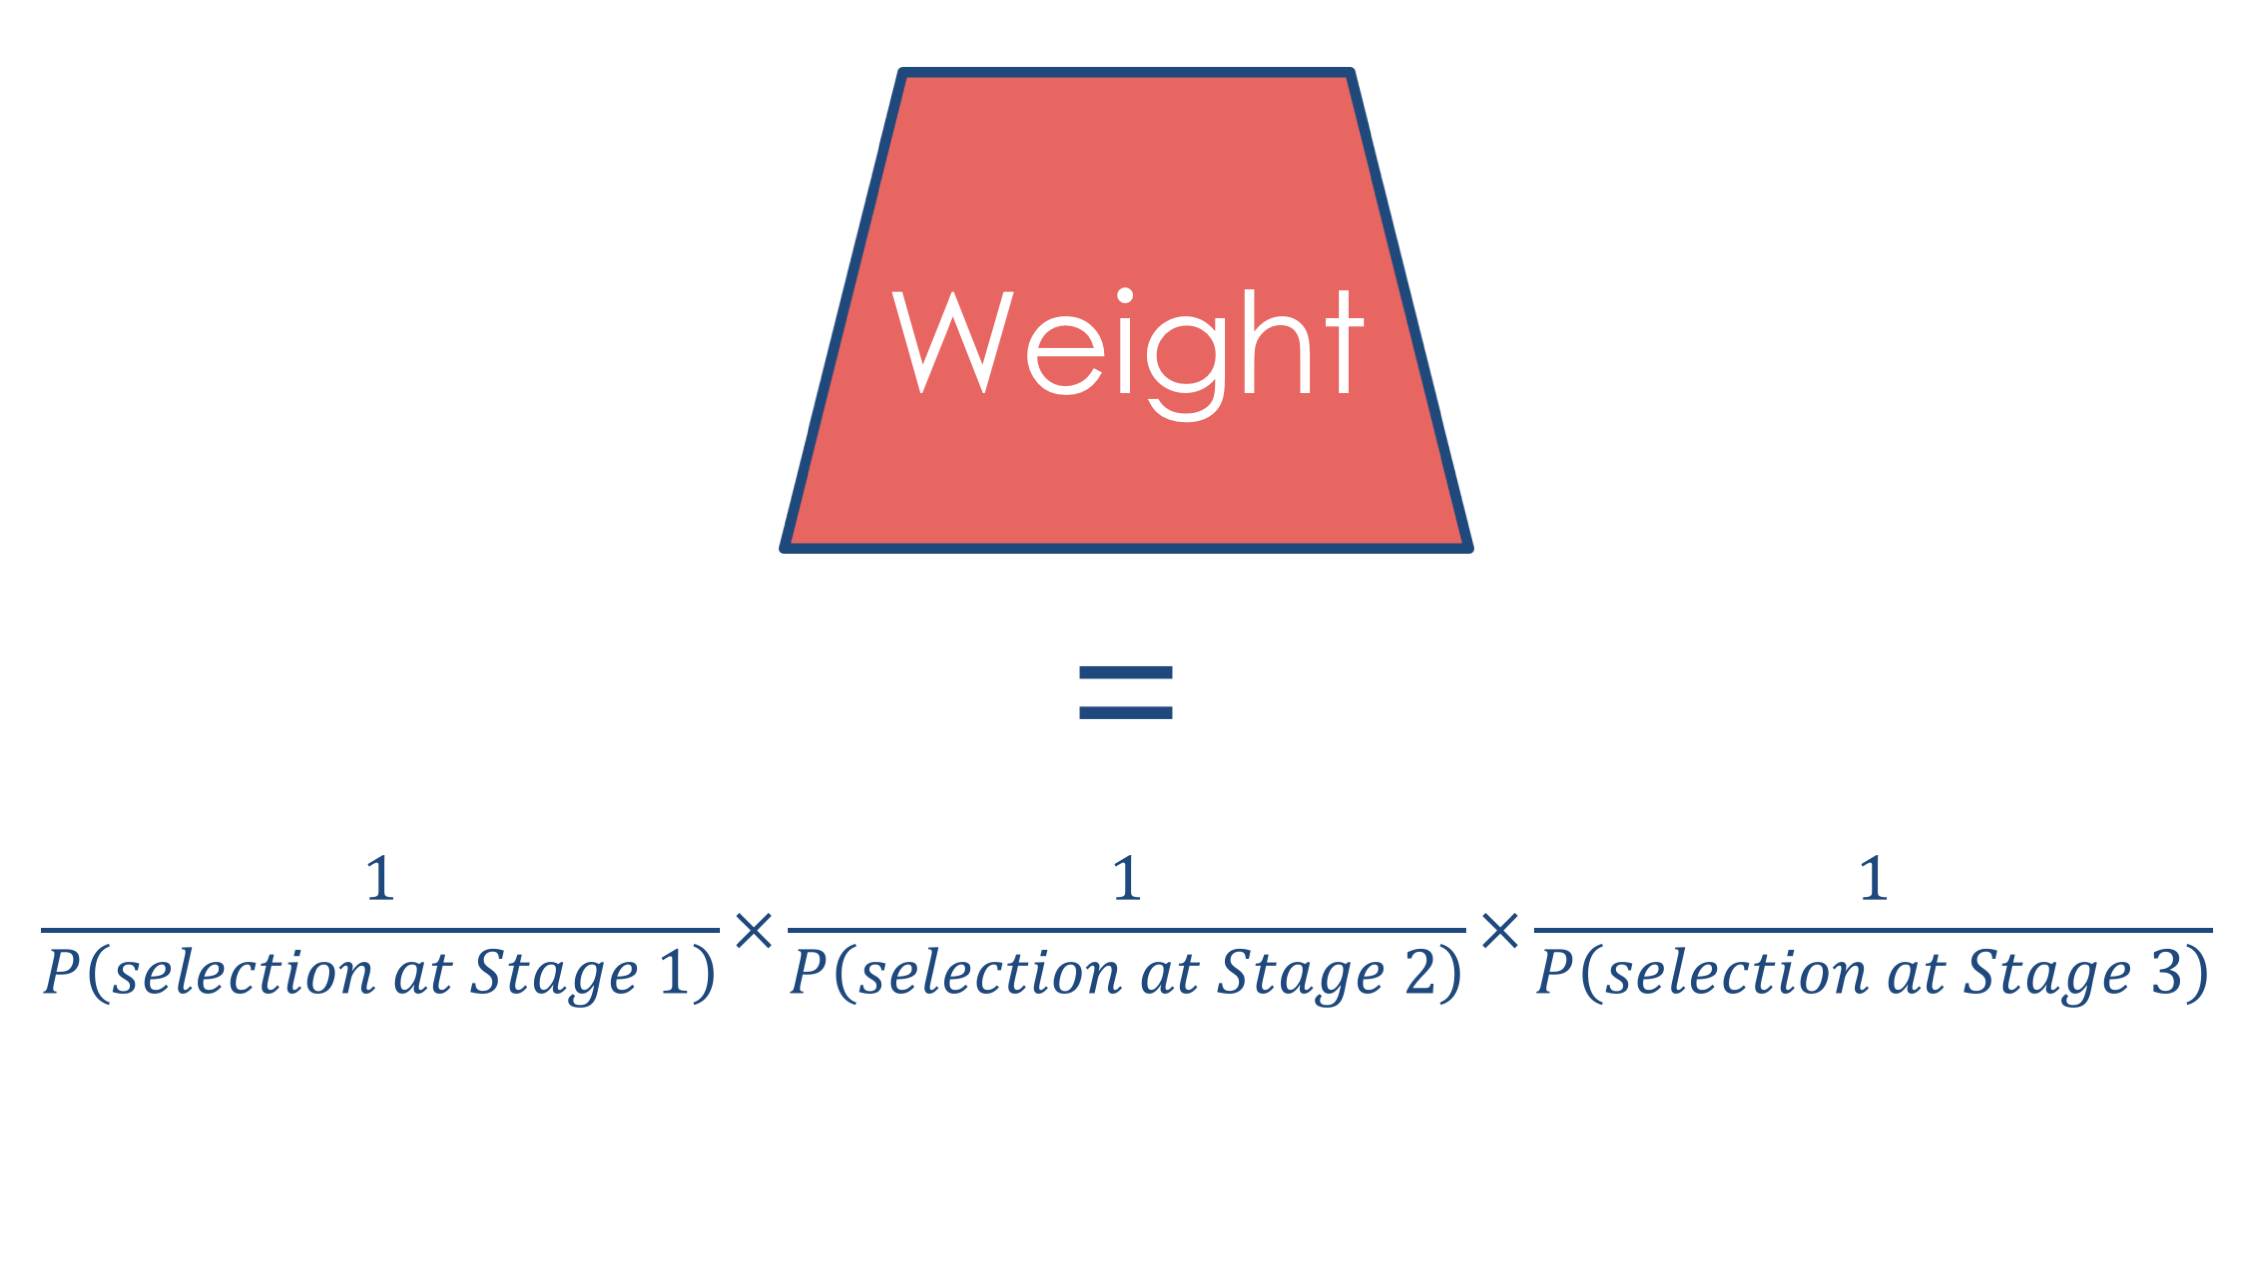
The weight is the product of the inverse of the probabilities of selection at each of the three stages in the sampling process.
For more information on the sample scheme: click here.
Design
- Incorporating the design in the statistical analysis is vital
In order to obtain the correct standard error estimates for a subpopulation, we need to properly account for the weights and design
- All analysis was completed using
R - We primarily utilized the survey package:
- T. Lumley (2014) “survey: analysis of complex survey samples”. R package version 3.30.
- T. Lumley (2004) Analysis of complex survey samples. Journal of Statistical Software 9(1): 1-19
Variable Definitions
0: No injury
1: Some injury (ranging from possible to fatal)
5 Stars: Injury risk for this vehicle is much less than average
4 Stars: Injury risk for this vehicle is less than average to average
2 or 3 Stars: Injury risk for this vehicle is average to greater than average or greater than average There were no one star vehicles in our data set
Adjusted for:
- Seat restraint misuse
- Speeding
- Indicator for interstate highway
- Weather
- Impact location
- Alcohol involvement
- Indicator for rollover
- Indicator for airbag deployment
- Manner of collision
- Age
- Sex
- Age x Sex
Fit a logistic model:
- Injured versus uninjured
- Adjusted for all covariates shown previously
- Fit an interaction between rating x weight class
Results
- Weighted sample: N=2,595,190
- Unweighted sample: N=19,428
- Merged 4 years of data (2011-2014)
- Included vehicles:
- had a safety rating (2011+)
- had passengers with known injury severity
| Maximum Injury in Vehicle | Weighted frequency (%) |
|---|---|
| No injury | 2,170,141.59 (83.6%) |
| Injury | 425,048.1 (16.4%) |
| NHTSA Safety Rating | Weighted frequency (%) |
|---|---|
| 5-stars | 936,457.93 (36.1%) |
| 4-stars | 1,448,491.93 (55.8%) |
| 2- or 3-stars | 201,239.8 (8.1%) |
Figures 1, 2, and 3 show the injury & safety ratings by weight class. Figure 2 shows the concerning result that 2-3 star rated cars in the mid-size weight class have proportionally fewer injuries. These results hold true after adjusting for the covariates, this result held true (Figure 4). Here is where we would love your input! Perhaps we missed an important confounder. All of the data can be found here along with our raw analysis files.
Figure 1: Maximum Injury by Saftey Rating (Weight <3000lb)
Figure 2: Maximum Injury by Saftey Rating (Weight 3000-3499lb)
Figure 3: Maximum Injury by Saftey Rating (Weight >3500lb)
Figure 4: Effect of 5-star ratings on log odds of injury, stratified by weight class, adjusting for accident condition variables (weather, point of impact, type of accident etc.) and passenger-level variables (age, sex, alcohol, seat-belt use, etc.), with 2-3 star rated vehicles as the reference.
To delve into this further, we have an interactive scatter plot, which allows the user to examine the specific make and star rating of each car, along with the % of accidents with at least one injured passenger (Figure 5).
Figure 5: Percent injured by rating & vehicle make and model.
Conclusions
We have some evidence to show that ratings contribute to whether or not passengers are injured, however this relationship is complex.
Limitations
- This analysis was limited to vehicles that were in accidents – we don’t know the distribution of ratings in the general population
- It is possible that 4 or 5 star cars are more likely to be rated than 2 or 3 star cars
- Limiting ourselves to using ratings from 2011-2014 drastically decreased our sample size and limited the information about other cars involved in each accident
- We were only able to observe 330 unique make/model/year combinations